Making Mountains...out of potentials
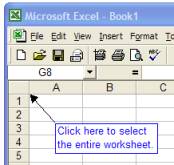
Open
Excel. Click in the block at the
intersection of the row and column headings to select the entire worksheet.
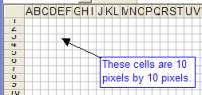
By
dragging on the edges of the row and column headings, adjust the worksheet so
that the cells are small and square.
Click
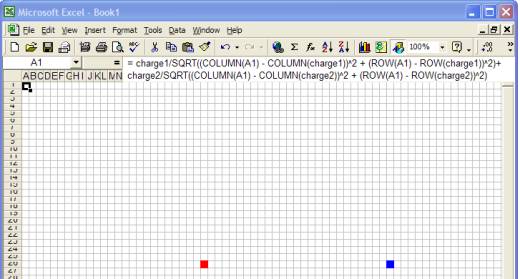
on cell A1 and enter the following formula. Keep a close eye on the
parentheses. Your best bet is to select the text below, copy it, and then paste
it into Excel
=
charge1/SQRT((COLUMN(A1) - COLUMN(charge1))^2 + (ROW(A1) - ROW(charge1))^2)+ charge2/SQRT((COLUMN(A1)
- COLUMN(charge2))^2 + (ROW(A1) - ROW(charge2))^2)
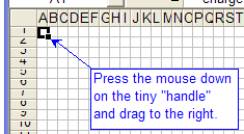
Now
duplicate the formula in cell A1 to the rest of the cells in the
first row, out to cell CZ1. The easiest way to do this is
to first click on cell A1 to select it, then drag the
small handle (in the lower right corner of the cell) to the right until you
reach cell CZ1. The cursor changes into a thin
"plus" sign when you are in the right position over the handle. Release the
mouse and the formula will have been inserted into each cell.
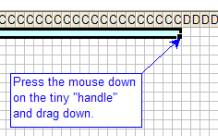
While
that row of cells (from A1 to CZ1) is selected,
drag them down to cell CZ52. That will fill in a large grid
with your formula.
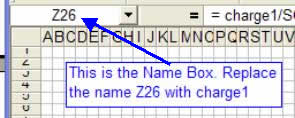
Move
to cell Z26 (It's hard to read the row numbers, but you can see where
you are by reading the Name Box in the
corner.) Replace the long formula with the single value of 3, to represent a +3
C charge. Click in the Name Box in the upper
left corner of the spreadsheet and replace "Z26" with "charge1" without the
quotes, of course. Notice that there is no space between the "e" and the "1". Now your
formulas will refer to this particular cell.
While
still on cell charge1 (formerly known as Z26) select Cells... from the Format menu and make
the cell a bright red color. Move to cell AZ26, replace its
formula with -3, to represent a negative 3 C charge. Then name the cell
charge2, and make it blue.
When
you are done, your screen should look like this:
Now
comes the fun part...select from A1 to CZ52 by pressing
the mouse down on CZ52 and dragging to cell A1, then
releasing. Click on the Gallery icon in the
toolbar so that you can make a graph. Then click Chart.
Select
the first Surface graph and behold your handiwork! You've created a 3-D
graph of the potential around a dipole. By clicking on the chart and moving the
handles around, you can view the scene from different directions.
There
are two pre-built spreadsheets for this. MakingMountains.xls (in the Files
area of the website) shows the finished dipole. This is useful when talking
about charges "rolling" down from high to low potential. It also helps you see
why defining V = 0 at infinity makes
sense. The area between the charges has V
= 0, but E ≠ 0. MakingMountains2.xls shows the
potential around four positive charges. The area between the charges has V ≠ 0, but E = 0.
