Grids with multiple colours
Grid with multiple colours
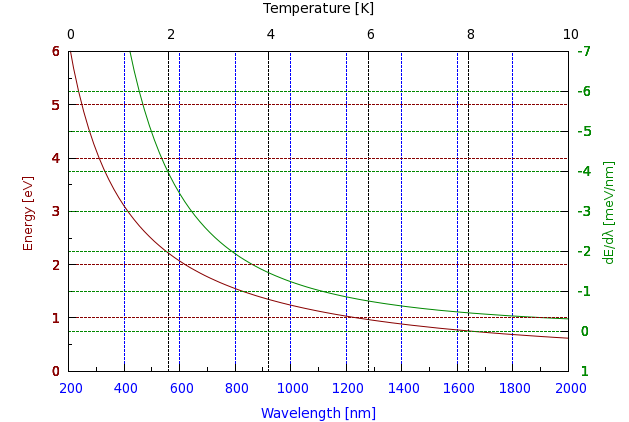
Sometimes, one needs a graph on which all four axes are used, and in addition to that, grids are also required. Now, the problem is, if you just plot a grid, it will be hard to follow which grid line corresponds to which axis. So, I decided to colour both the grid, and the axes, and use the same colour for corresponding grid lines and axes. Well, this is what I decided, but then it turned out to be a rather hard nut to crack. There is a work-around, however, so if you are interested, you can find the details below. But let us see the graph first!
The standard way of defining a grid is a line similar to this:
set grid ytics lt 0 lw 1 lc rgb "#880000"
First, we define where we want to have the grid (everywhere, where there is an ytics), then the linetype, the line width, perhaps, and the colour. The problem is that when you issue this command multiple times, for some reason, only the last colour setting will take effect, i.e., if after the line above, you happened to have
set grid y2tics lt 0 lw 1 lc rgb "#008800"
then gnuplot would place the grid lines at y2tics all right, but the grid lines at ytics would also be green, and this is not what we want. The way out of this difficulty is to trick gnuplot into thinking that we have more than one plot, and re-set the grid before each new plot. Of course, we don't actually want to plot anything after the first one, therefore, we will just plot 1/0. It is a vicious way to deceive gnuplot, but it does the trick. Now, here is the script
reset
h=4.136e-15 # eV s
hbar=6.57e-16 # eV s
c=3e17  # nm/s

set multiplot
unset key
set xlabel 'Wavelength [nm]' tc rgb "#0000ff"
set x2label 'Temperature [K]'
set ylabel 'Energy [eV]' tc rgb "#880000"
set y2label 'dE/d{/Symbol l} [meV/nm]' tc rgb "#008800"
set xrange [200:2000]
set x2range [0:10]
set yrange [0:6]
set y2range [1:-7]
set y2tics 1,-1,-7
set ytics nomirror tc rgb "#880000"
set y2tics tc rgb "#008800"
set xtics nomirror tc rgb "#0000ff"
set x2tics
set mxtics 2
set mytics 2
set grid xtics lt 0 lw 1 lc rgb "#0000ff"

plot h*c/x w l lc rgb "#880000", -1000*h*c/x/x axes x1y2 w l lc rgb "#008800"

unset grid
set xlabel " "
set xtics format " "
set x2tics format " "
set x2label " "
set ylabel " "
set y2label " "
set grid x2tics lt 0 lw 1 lc rgb "#000000"
plot 1/0

unset grid
set grid ytics lt 0 lw 1 lc rgb "#880000"
plot 1/0

unset grid
set grid y2tics lt 0 lw 1 lc rgb "#008800"
plot 1/0

unset multiplot
First, we define a couple of constants, and then set up the axis labels. Note that when doing so, we assign a colour to each axis, so that we will know which axis the plot belongs to. Of course, we could do this with arrows, but since we want to have coloured grids, it is better to do it in this way. Next, we set the various ranges, and then set up the first grid line, which will be drawn at every xtics, and in blue. (Blue was the label colour of x.) After plotting the curves, we unset the grid, and we also take off the labels and ticlabels. Note that when doing so, we, in fact, re-set the labels, but with an empty string. The reason for this is that, if we simply take off the labels, then the margins of the graph will change, and when we plot our next graph (which is empty, but we still need the grid), it would be of a different size, and would not align with our original plot. Having re-labelled the graph, we re-set the grid, this time putting the lines on x2tics in black, then on ytics in a dark shade of red, and finally, on y2tics, in dark green. At the very end, we unset the multiplot, i.e., escape from the whole plot. This solution is a bit dirty, but if you are pressed for it, it should still be OK.
by Zoltán Vörös © 2009